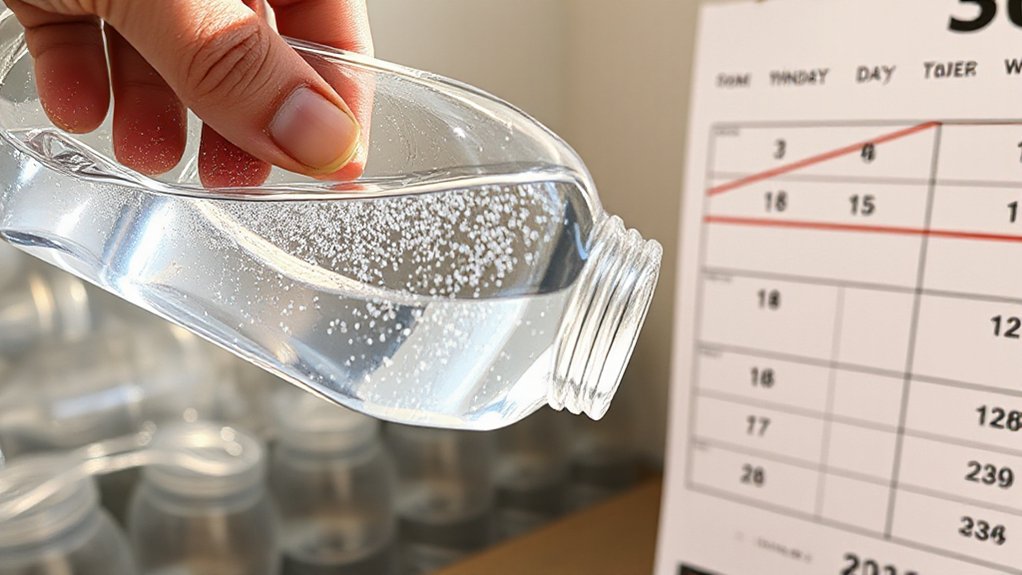
How much plastic are you actually drinking? Probably way more than you think. That convenient bottled water habit isn’t just draining your wallet—it’s flooding your body with microplastics. About 90,000 microscopic particles annually, to be precise.
Your bottled water habit is a microplastic subscription—delivering 90,000 invisible particles straight to your body every year.
The global bottled water market is massive—valued at nearly $289 billion by 2025. People worldwide are chugging over 446 billion liters yearly. Americans alone down about 47 gallons per person annually. That’s a lot of plastic bottles. Like, 1.3 billion used daily. A million per minute. Let that sink in.
Scientists have found these bottles shed microplastics like crazy. We’re talking tens to thousands of particles per liter, depending on who’s counting and how. The smallest bits—those under 100 micrometers—are everywhere in bottled water. Too small to see, but definitely there. What’s even more alarming is that approximately 60% of bottled water globally is just purified tap water, not the spring or mineral water many consumers believe they’re purchasing.
And guess what? They’re made of the same stuff as the bottles: PET, polypropylene, polyethylene. Shocking, right?
The math is pretty straightforward. Take your average daily liter of bottled water. Multiply by the particles per liter (around 250 in some studies). Do that for a year. Boom—90,000 microplastics. Annually. Going straight into your system.
These aren’t just random numbers. Multiple peer-reviewed studies have confirmed this plastic contamination. Some have found even higher counts. The variation comes from different measuring techniques and size thresholds. Smaller detection thresholds equal higher particle counts. Duh.
And it gets worse. Those tiny fragments and fibers? They’re just what we can currently measure. Nanoplastics—even smaller particles—likely lurk below current detection limits. Despite health concerns, bottled water consumption has grown consistently every year since 1977, with two exceptions during the 2008-2009 financial crisis.
References
- https://wifitalents.com/bottled-water-statistics/
- https://www.beveragemarketing.com/news-detail.asp?id=825
- https://bottledwater.org/wp-content/uploads/2025/07/BWR_BWstats_June2025_FinalwithBMCad.pdf
- https://tappwater.co/blogs/blog/how-many-people-consume-bottled-water-globally
- https://www.statista.com/chart/31771/respondents-who-say-they-regularly-drink-bottled-water/
- https://www.bevindustry.com/articles/97629-2025-state-of-the-beverage-industry-bottled-water-remains-popular-due-to-health-and-wellness-associations
- https://www.factmr.com/report/still-bottled-water-market
- https://www.aquasana.com/info/important-plastic-water-bottle-stats-pd.html
- https://vivreauwater.com/water-dispensers/blog/press/hydration-habits-survey/